IF YOU HAVE A GAMBLING/SPORTS BETTING ADDICTION PLEASE SEEK HELP.
Gambling Addiction Hotline: 1-800-GAMBLER
Introduction:
Sports betting has become a significant industry in the U.S., growing at an exponential rate. In 2023 alone, Americans wagered a record-breaking $119.84 billion on sports betting, according to the American Gaming Association. As sports betting continues to expand in popularity, particularly with the increasing legalization in various states, this figure is expected to rise further in the coming years.
When you think about it, sports betting is essentially applied data science. Bettors and oddsmakers alike analyze vast amounts of data — player performance, team stats, injury reports, and other factors — to make predictions about the outcome of games. The objective of this project is to determine whether a simple supervised machine learning model, specifically using linear regression, can effectively predict the passing yards of NFL quarterbacks. By leveraging historical data, we aim to see if our model can arrive at conclusions similar to those of professional oddsmakers in Las Vegas.
Dak Prescott was chosen for this analysis due to his extensive data set. As the longest-tenured active starting quarterback for a single team, Prescott has accumulated a large amount of historical data, which is invaluable for building a predictive model. The more data we have, the better our chances of developing an accurate model. Additionally, his career spans various seasons and matchups, allowing us to evaluate his performance in different contexts.
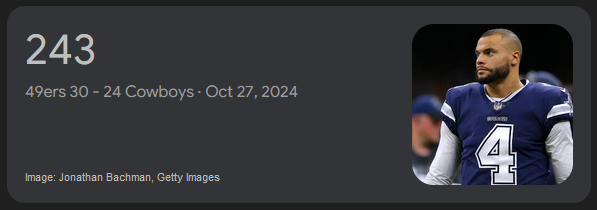
The project focuses on predicting Dak Prescott’s passing yards against specific defenses, the Cowboys will be playing the San Francisco 49ers this weekend (October 27th, 2024), so we will be trying to predict Dak's passing yards for this game.
Data:
I was able to get all the data I needed from www.pro-football-reference.com. So thanks to them!
I started out by building the model in Jupyter notebooks, going over the data, and then finalizing it in a separate python file.
If you would like to check out the notebook you can check it out here:
- Notebook PDF: Link

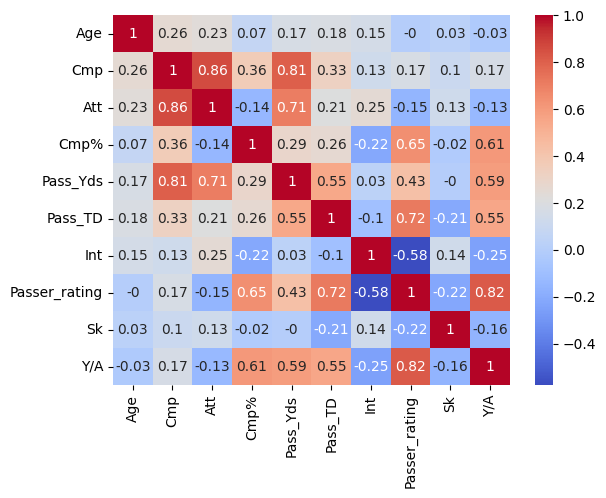
In the correlation matrix we can see how correlated the features of the model are to each other. The one we care about the most is the correlation with our target, passing yards.
We can se the most correlated relation with passing yards is completions, pass attempts, passing touch downs, passer rating and passing yards per attempt.
For right now we will be using all the features shown in the matrix, and we will be talking more about this and things like multicollinearity a little later on.
Now we have our features, target, and data.
Code:
Git Hub Repo: Link (Changes have been made since initial post)
Here is a quick breakdown of the code. We will start with the the final function, and then breakdown each sub function.
def prediction(data, features, target, norm1, norm2):
    df = read_data(data)

    X_train, X_test, y_train, y_test = split_data(df[features], df[target])

    model = train_model(X_train, y_train)
    test_model(model, X_test, y_test)

    # Convert prediction result to float
    final_predict = model.predict(test)
    final_predict = final_predict[0, 0]
    final_predict = float(final_predict)
    norm_predict = (norm1/norm2) * final_predict # Normalize

    # Display results
    print(f'Average Pass Yards vs Opponent: {qb_passYards_opp:.2f}')
    print(f'Average Opponent Pass Yards Allowed 2024: {opp_passYards_allowed:.2f}')
    print(f'Predicted Pass Yards: {final_predict:.2f}')
    print(f'Predicted Normalized: {norm_predict:.2f}')
Reading the Data:
def read_data(data):
    df = pd.read_csv(data)
    df = df.dropna()
    return df
Split the Data:
def split_data(features, target):
    X_train, X_test, y_train, y_test = train_test_split(features, target, test_size=0.2, random_state=69)
    return X_train, X_test, y_train, y_test
Train the Model:
def train_model(X_train, y_train):
    linear_reg = LinearRegression()
    linear_reg.fit(X_train, y_train)
    return linear_reg
Test the Model:
def test_model(model, X_test, y_test):
    prediction = model.predict(X_test)

    mae = mean_absolute_error(y_test, prediction)
    maePer = mean_absolute_percentage_error(y_test, prediction) *100
    mse = mean_squared_error(y_test, prediction)
    r2 = r2_score(y_test, prediction)
    print(f'Mean Absolute Error: {mae:.2f}\nMAE %: {maePer:.2f}\nMean Squared Error: {mse:.2f}\nR2 Score: {r2:.2f}')
Results:
Now is the moment we have all been waiting for lets see what the model thinks.
    Age        Cmp        Att       Cmp%   Pass_TD    Int  Passer_rating        Sk       Y/A
0  31.25  16.064542  22.986486  69.882415  3.111111  0.875     123.211559  0.714286  9.405627

Mean Absolute Error: 8.67
MAE %: 6.08
R2 Score: 0.98

Average Pass Yards vs Opponent: 210.67
Average Opponent Pass Yards Allowed 2024: 205.14
Predicted Pass Yards: 227.75
Predicted Normalized: 233.89
The model has spoken, 234 passing yards for Dak this weekend, with all being said that sounds more than reasonable.
You may be wondering how we came to this "normalized" conclusion, since I never went over that yet. Since we do not Dak's passing TDs, passer rating, ect..., we kind of have to make them up, a historically backed guess. The inputs we put into the model to come to this conclusion were derived from the average of Dak's historical stats versus the 49ers, and the complementary defensive stats for the 49ers this year. There were multiple ways we could have done this (we will probably explore those in another project) but thats what I choose this time. Here is an example of how I normalized the data:
(Dak's Historical Stat Average vs The 49ers / Average 49er Defensive Stat for 2024) * Dak's Historical Stat Average vs The 49ers
Earlier in the Data section I talked about the correlations between our target and the other features. So lets make some adjustments and see how they effect the outcome. We are going to remove the following features:
- Age (0.17)
- Completion % (0.29)
- Interceptions (0.03)
- Sacks (0)
We can see based off their correlation score these features are not really correlated to passing yards so they act as background noise if you will.
- Attempts
- Passer Rating
We will be removing these as well as they have high correlation with other features, which could lead to multicollinearity, the potential for redundant information to be highly weighted in the model.
After removing those features this is what the model has to say:
        Cmp   Pass_TD       Y/A
0  16.064542  3.111111  9.405627

Mean Absolute Error: 31.60
MAE %: 14.64
R2 Score: 0.83

Average Pass Yards vs Opponent: 210.67
Average Opponent Pass Yards Allowed 2024: 205.14
Predicted Pass Yards: 235.54
Predicted Normalized: 241.88
Now the model says 242 passing yards, still extremely reasonable and not that far off from the original prediction.
Conclusion:
Heres the O/U lines for the odds makers as of 10/23/2024 @ 10:30pm ET, Thanks to bettingpros.com, who have Prescott projected for 246.3 passing yards.
 Image from: bettingpros.com
When the prop bets started coming out, the consensus line was 257 yards, now we are starting to see it come down to our models predictions.
My model and the odds makers have a margin of only 5 yards as of right now, not bad for some backyard data science.
Well the results are in and drum roll...

Off by one yard! But, lets be realistic this is only one data point, and this is a very very very basic model. The vegas models take in a plethora of other data (Weather, Location, Injuries, etc.), so it is highly likely this result is just a coincidence. But, I will be tracking the rest of the cowboys games for the remainder of the season here, so if you are interested in this project keep checking in. Thanks for reading!
Updates
So there has been some problems since the first run of the project and hindsight is 20/20 after all. (And yes the first prediction does seem to be a very correlated coincidence)
1. The way I was normalizing the inputs is flawed, some match ups like the week 9 DAL vs ATL game would blow up (in this case 130%-ish) leading to predictions of 430 passing yards. which while not impossible were unlikely.
2. The NFL does have a recency bias, so normalizing for games years in the past is not conclusive for predicted outcomes. Players (especially QBs)tend to perform better later in careers.
3. Dak got injured in the game versus ATL effectively putting the project at a stand still, having one testing point was a major flaw.
So, since I plan on making a more generalized model next year anyways its probably better I add more diverse field of QBs to track. The next two most longest tenured QBs for a single Team are Patrick Mahomes and Josh Allen, I will also be following Jayden Daniels and CJ Stroud to see how the model handles players with a limited data set. Lastly Aaron Rodgers, as he is the longest tenured starting QB in the NFLl, he will be our outlier case.
Since this a more diverse cast of QBs I have changed up the model, no longer will we be using Linear Regression instead it will be Lasso Regression (basically a modified linear regression model). Lasso regression can handle feature selection for us (if it find features are not correlated to the predicted outcomes they are less weighted or weighted zero in the calculation), so I will not have to test each QBs data set to see how features interact with each other and tailor the model individually. This leads to more generalization.
Last is the way way normalization is now handled. I will no longer normalize the predicted outcome because it is based off of normalized inputs, so it is pseudo-normalized already. The inputs will be normalized using the QBs 2024 season stat averages against the opposing Defenses 2024 season stat averages. To avoid over-fitting the model 2024 samples were removed from the data sets.
Thats it for now to keep up to date check out the project page you can also download the data sets and individual models code used fro each prediction there. Additionally you can get all of that onb the projects Github Page as well. Thanks for reading!